


The queue between a business and its numbers is gone. Not shrinking. Gone.
For as long as most of us have worked, the slow part of any dashboard was never the data. It was the road between the data and the person who needed it. Requirements written up and signed off. A tool chosen. The data modelled into cubes and tables. A bench of developers. A queue of change requests. And some months later, a screen that answered last quarter's questions. Every layer on that road had a reason to exist. Every layer was also fat.
AI has eaten the road. A requirement call, transcribed, becomes a working dashboard in days. A change, described in a sentence, lands in hours. The drawing is fast now, and it is not going back to slow.
So the temptation is obvious: ask it everything. And here is the catch, because it is the same catch you would hit with people. Ask a slow team for everything and it gets confused and hands you rubbish. Ask a fast machine for everything and it hands you rubbish faster. What remains between a business and its numbers is not a technology gap any more. It is a decision: what should this screen point at, and what are its numbers allowed to mean?
How it was
How it is
Start with the North Star
Before any of the speed matters, one decision has to be made, and it is not a technical one. What is the one number each part of this business steers by?
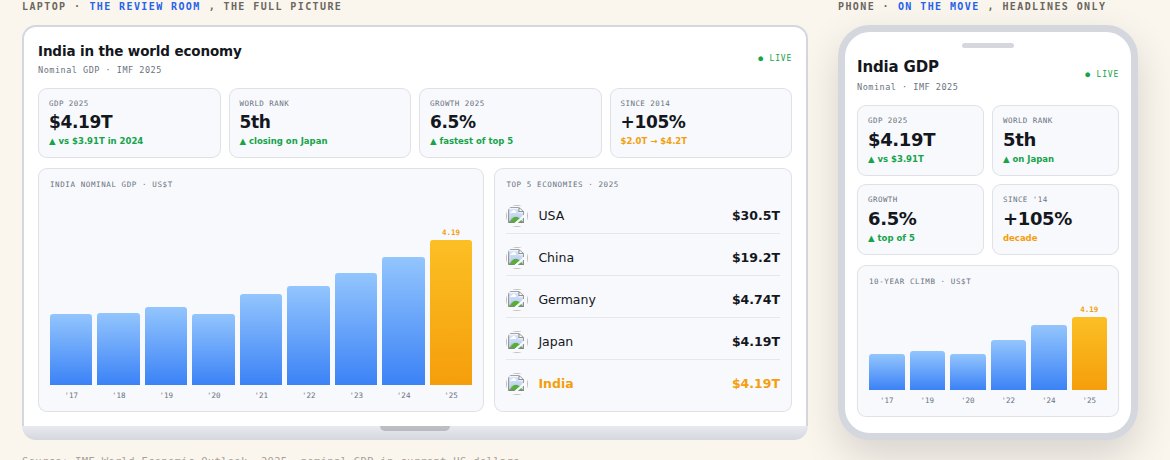
A dashboard is a set of arrows. If they point in different directions, people follow different ones, and the screen becomes wallpaper. So every dashboard we build has a North Star metric at the top, and the rest of the screen exists to explain movement in that number. Sales steers by month-to-date against target. Collections steers by cash collected against what is outstanding. Operations by cost per delivery. Finance by margin. Different altitudes, one direction.
Three things follow from that, and all three are human work.
- Choose the few numbers, not the many. The twelve that management actually decides on, not the two hundred that could be measured.
- Define each one once, in writing. "Target", "active customer", "margin" mean one thing on every screen, for the rep, the analyst and the owner.
- Get the screen opened. A morning review wired into how the business runs. A dashboard nobody opens is a report.
Get the North Star right and speed is a gift. Get it wrong and speed only spreads confusion faster.
The first build is the fast part now
Here is the change. From day one, the requirement-gathering call is recorded and transcribed, and the transcript is fed to AI. The AI drafts the data queries and draws the front end. We review it against the North Star and the definitions. Wireframes the day we talk, a live dashboard in two to three days. Nothing sits in a backlog, because there is no backlog.
We have run this for two years on a ₹150 crore distribution business that sells to hotels, restaurants and modern retail. SAP at the back, SQL in the middle, Power BI in front, four functions on one screen: sales, collections, operations, finance. The time never went into the data. The data was there on day one. It went into the front end, and into the queue in front of it. Every screen, and every change to one, was a skilled person's afternoon, and there were only so many afternoons. Feeding the transcript to AI removed the afternoon, and with it the queue.
Changes on the fly, through a system, not a queue
A dashboard is never finished, and the way change requests travel is the second place the fat lives: a call, a note, a ticket in someone's inbox, a slot next month. We replace that queue with a system. Anyone logs a question or a gripe in a box inside the dashboard, the moment it occurs to them, like a ticket but where the numbers live. Prefer email? Write to us as you would to any vendor, and the mail lands in the same list. Nothing is lost.
Then the human part, which is the important part. We take the list to management. The manager decides which requests are right for the business and which are curiosity. We shape the approved ones into a proper ask, in the shared definitions, and only then does AI build the change. We review, we ship, usually within hours. Then it loops.

The architecture, in one picture
This is what a self-hosted platform with AI behind it looks like, and how the changes loop back in.
Your data
The AI build layer
The screen
What you get, listed plainly
- One number at the top of every screen, and the rest of the screen explaining it.
- A first build in days, from the transcript of the requirement call.
- A request box inside the dashboard, and an email route, feeding one list.
- A manager in the loop before anything is built.
- Changes shipped in hours once approved.
- Your choice of Power BI, Tableau, or a self-hosted React JS front end.
- On self-hosted: no per-seat licence, and you own the code.
- One shared set of definitions, live data, and one build for laptop and phone.
Where fast goes wrong
The trap is worth naming. Once a screen is cheap to change, everyone wants their own. Sales asks "how are we doing this month" and gets sales booked. Finance asks the same words and gets sales invoiced. Operations asks and gets sales despatched. Three honest answers, three different numbers, one argument in the Monday meeting. The tool did nothing wrong. Nobody decided what "sales" means, so everyone decided for themselves.
That is why the North Star and the definitions come first, and why the manager sits in the loop. Speed without that is not a saving. It is rubbish, faster.
An honest note on developers
Do you still need developers? Yes. Fewer of them, on sharper work. What you no longer need is a bench whose main job was to carry requests across the gap.
And yes, you can talk to it
One more thing, and it is icing, not the cake. On a warehouse that is already in sync, a conversational layer is a beat's work: ask in plain English or Hindi, get a chart back. We build it, people like it. It is not the point. The point is that the ordinary, traditional dashboard, the one your team opens every morning, can now be built in days, changed in hours through a system, and kept pointed at one number. That is simply the smarter way to do it.
Build it fast. Change it through a system. Point it at one number.
The thinking is still the work. The drawing is fast now, and there is no reason to pay for the fat.
Photo: Pexels, free licence.